Introduction & Demo
Concise overview
Current release: Radical Red Panda (3.1.1)
The goals of Chanjo are quite simple:
- Integrate seamlessly with
sambamba depth regionoutput - Break down coverage to intuitive levels of abstraction: exons, transcripts, and genes
- Enable explorative coverage investigations across samples and genomic regions
Demo
The rest of this document will guide you through a short demo that will cover how to use Chanjo from the command line.
Demo files
First we need some files to work with. Chanjo comes with some pre-installed demo files we can use.
$ chanjo demo && cd chanjo-demo
This will create a new folder (chanjo-demo) in your current directory and fill it with the example files you need.
Note
You can name the new folder anything you like but it must not already exist!
Setup and configuration
The first task is to create a config file (chanjo.yaml) and prepare the database. Chanjo will walk you through setting it up by running:
$ chanjo init
$ chanjo db setup
Note
Chanjo uses project-level config files by default. This means that it will look for a chanjo.yaml file in the current directory where you execute your command. You can also point to a diffrent config file using the chanjo -c /path/to/chanjo.yaml option.
Defining interesting regions
One important thing to note is that Chanjo considers coverage across exonic regions of the genome. It’s perfectly possible to compose your own list of intervals. Just make sure to follow the BED conventions (http://genome.ucsc.edu/FAQ/FAQformat.html#format1). You then add a couple of additional columns that define relationships between exons and transcripts and transcripts and genes:
If an exon belongs to multiple transcripts you define a list of ids and an equal number of gene identifiers to match.
Linking exons/transcripts/genes
Let’s tell Chanjo which exons belong to which transcripts and which transcripts belong to which genes. It’s fine to use the output from Sambamba as long as the two columns after “strand” are present in the file.
$ chanjo link sample1.coverage.bed
Loading annotations
After running sambamba depth region you can take the output and load it into the database. Let’s also add a group identifier to indicate that the sample is related to some other samples.
$ for file in *.coverage.bed; do echo "${file}"; chanjo load "${file}"; done
Extracting informtion
We now have some information loaded for a few samples and we can now start exploring what coverage looks like! The output will be in the handy JSON lines format.
$ chanjo calculate mean sample1
{
    "metrics": {
        "completeness_20": 90.38,
        "completeness_10": 90.92,
        "completeness_100": 70.62,
        "mean_coverage": 193.85
    },
    "sample_id": "sample1"
}

$ chanjo calculate gene FAP MUSK
{
    "genes": {
        "MUSK": {
            "completeness_20": 100.0,
            "completeness_10": 100.0,
            "completeness_100": 99.08,
            "mean_coverage": 370.36
        },
        "FAP": {
            "completeness_20": 97.24,
            "completeness_10": 100.0,
            "completeness_100": 50.19,
            "mean_coverage": 151.63
        }
    },
    "sample_id": "sample5"
}
[...]

$ chanjo calculate region 11 619304 619586
{
    "completeness_20": 100.0,
    "completeness_10": 100.0,
    "completeness_100": 100.0,
    "mean_coverage": 258.24
}
$ chanjo calculate region 11 619304 619586 --per exon
{
    "metrics": {
        "completeness_20": 100.0,
        "completeness_10": 100.0,
        "completeness_100": 100.0,
        "mean_coverage": 223.3904
    },
    "exon_id": "11-619305-619389"
}
{
    "metrics": {
        "completeness_20": 100.0,
        "completeness_10": 100.0,
        "completeness_100": 100.0,
        "mean_coverage": 284.23
    },
    "exon_id": "11-619473-619586"
}
Note
So what is this “completeness”? Well, it’s pretty simple; the percentage of bases with at least “sufficient” (say; 10x) coverage.
What’s next?
The SQL schema has been designed to be a powerful tool on it’s own for studying coverage. It let’s you quickly aggregate metrics across multiple samples and can be used as a general coverage API for accompanying tools.
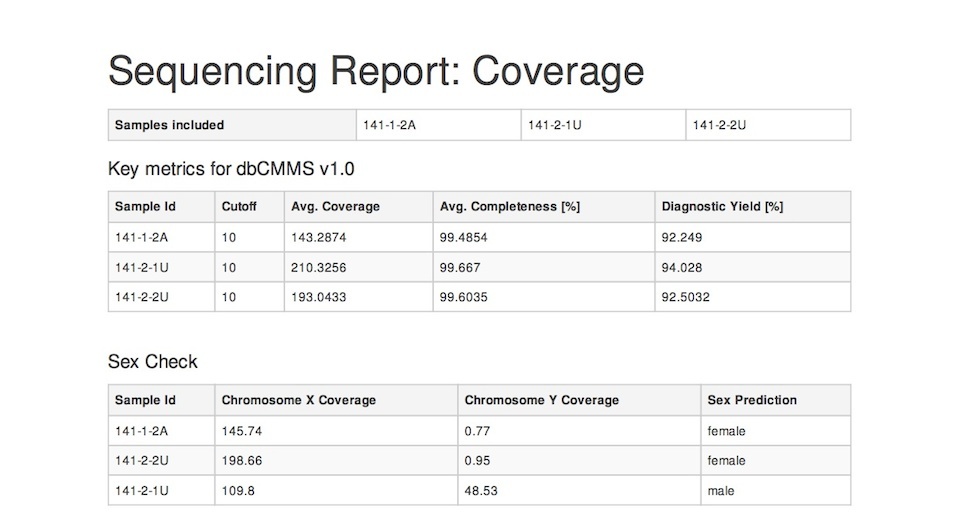
One example of such a tool is Chanjo-Report, a coverage report generator for Chanjo output. A report could look something like this (click for the full PDF):